
Google Analytics is a great tool to use to track trends and determine if your marketing is effective—as long as it is setup correctly. It is difficult to believe how many people spend money on marketing, but don’t track it on at least a basic level. It is a great way to discover trends and improve your return on investment. In this article, I’ll cover the following:
In this article, I’ll cover the following:
- Why you should use Google Analytics
- How to set it up properly
- How to get data out of it
Why should I use Google Analytics?
To start with, you want to know some basic data like how many people are coming to your website, where are they coming from, if they are becoming leads, or more important if they are becoming customers.
You need to know what channels people are coming from so that you know what marketing is working. You tell Google where people came from by using parameters on the end of your marketing URLs. You can create these parameters using Google’s UTM tool. You can then set up goals in Google Analytics to tell if your traffic is converting to leads. And you can tell if your traffic is converting to customers by using the e-commerce tracking.
Sound like valuable data to you? Thought so. Let’s dig in.
How to setup Google Analytics
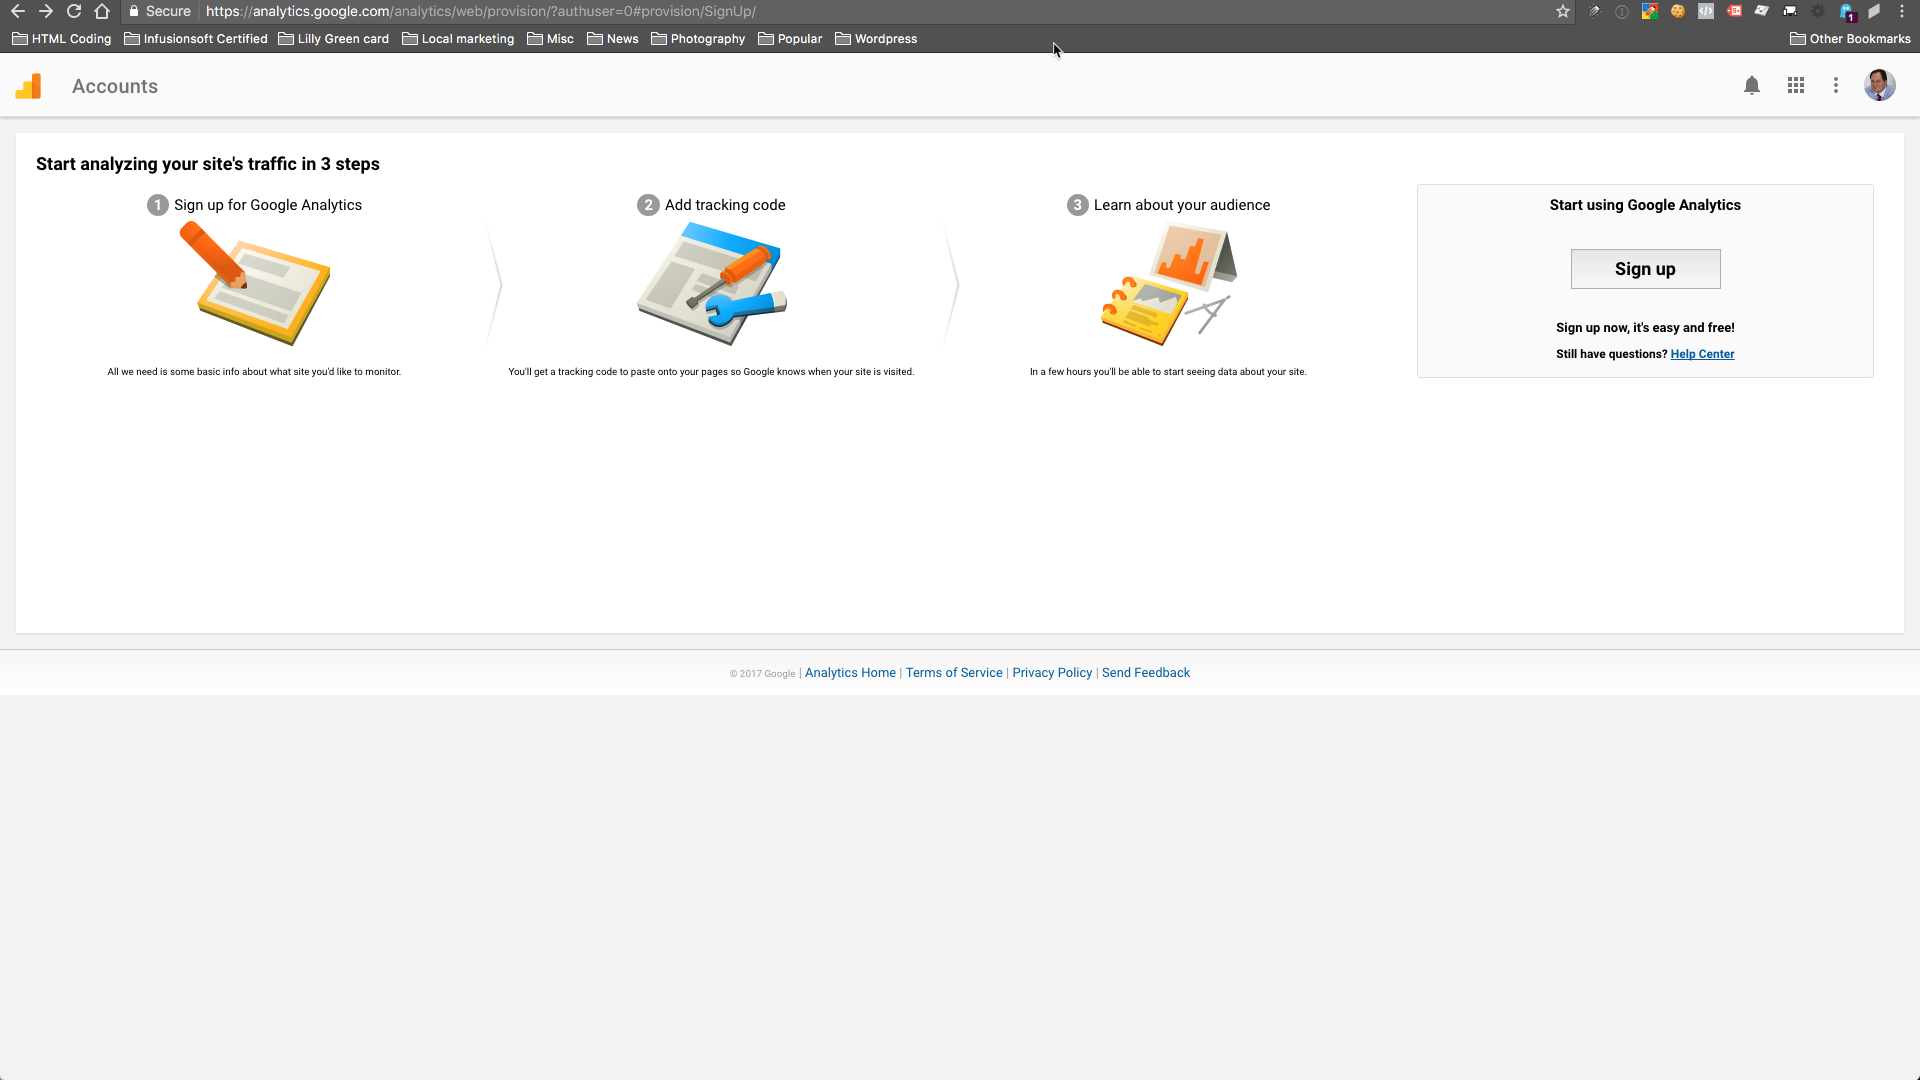
To set it up you need to go to analytics.google.com. You will log in with a Google account and then create your analytics account. To get started, click on the sign-up button.
You then need to create your first account.
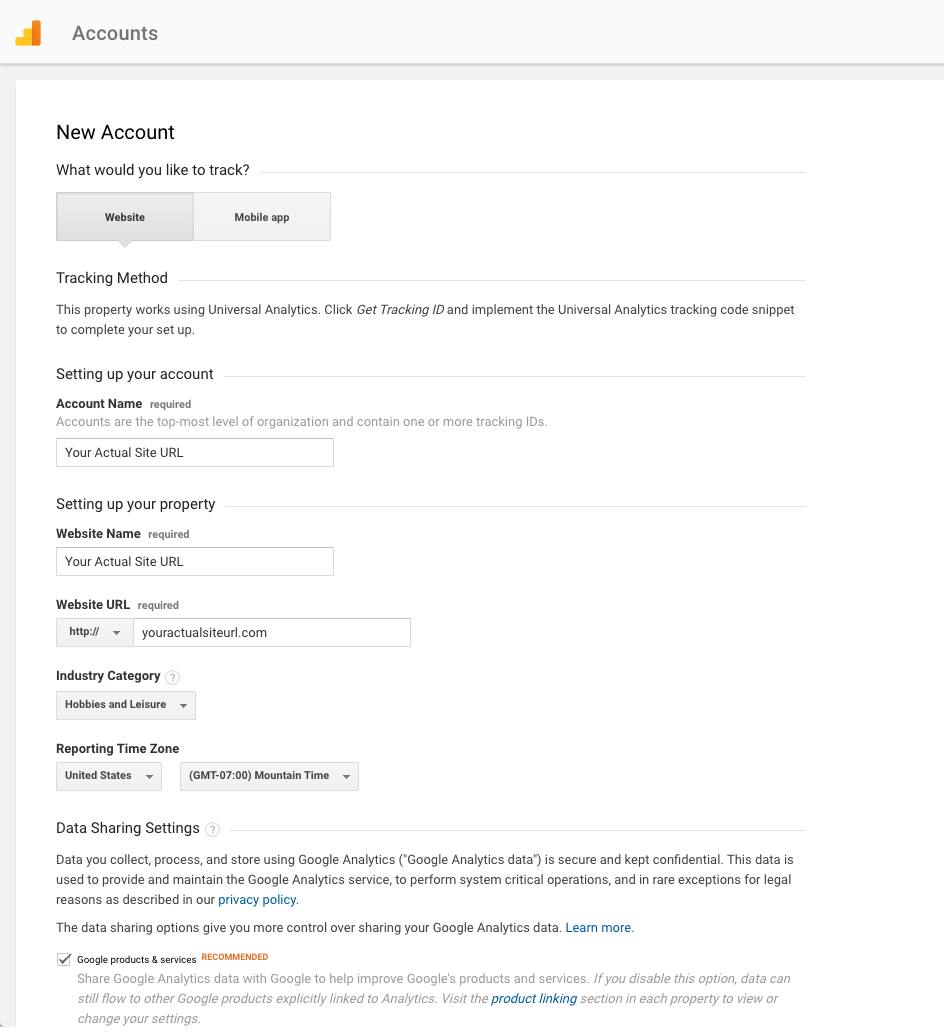
Scroll down to the bottom and click “Get tracking ID.” That will create the basic shell of the account.
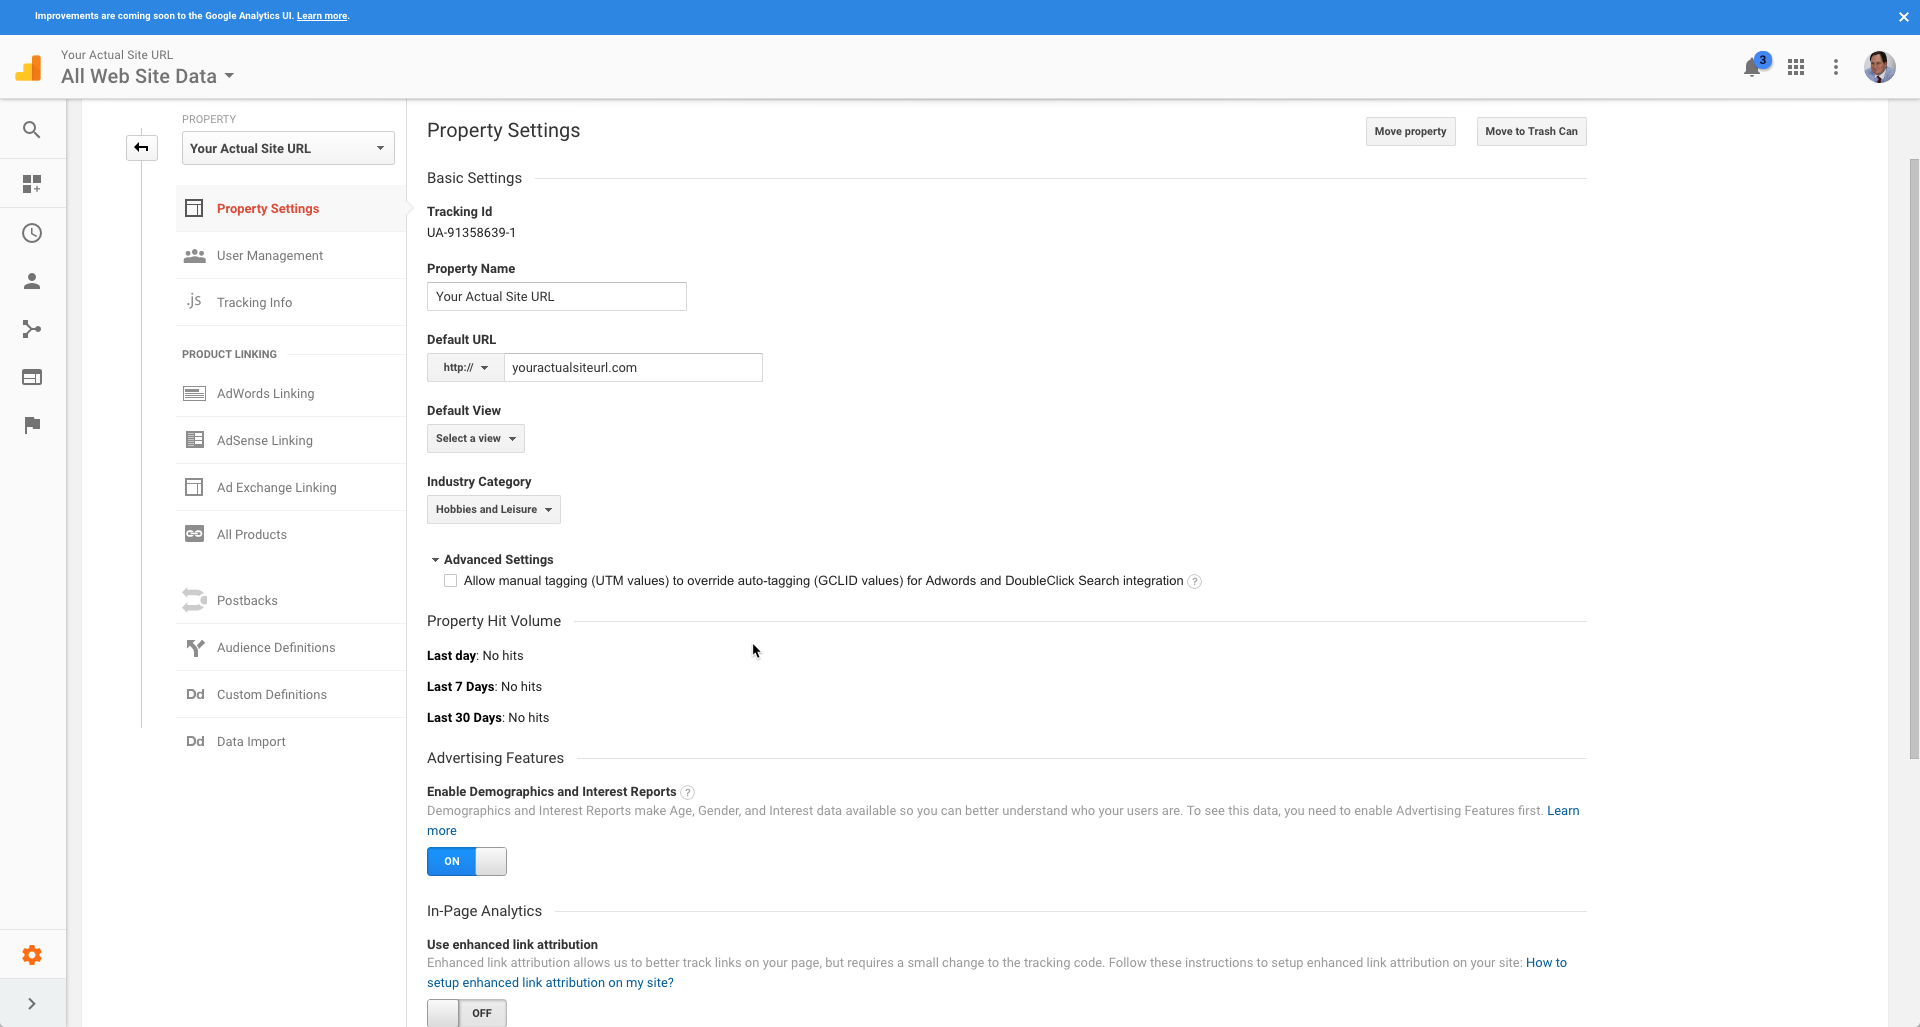
You then need to set up some key parts under the property settings. Make sure you enable Demographics and Interest Reports.
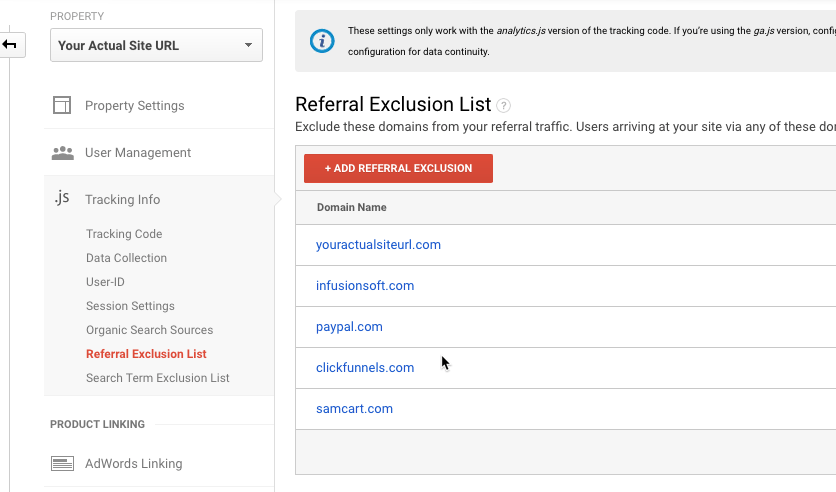
The next thing you want to do is set up your referral exclusion list under tracking info > referral exclusion list. You want to exclude any third-party pages you use to power your site and marketing efforts, as well as your own URL.
The next thing you need to do is set up your views. You need at least three views.
All data: Contains all unfiltered data. Make sure you have the bot filtering turned on otherwise you will get a lot of junk data.
A test view: Contains data that has been filtered. You try out new filters and goals here before moving them to your live view.
A live view: Contains data that has been filtered by tested filters and goals so that you do not lose data you would like to keep.

To create the other views, simply click on the copy view button at the top of the view page.
You will then create your test filters in you test view and test for a day or two before moving to your master view. To move the filters, you just select them from the existing filters so you do not have to recreate them.
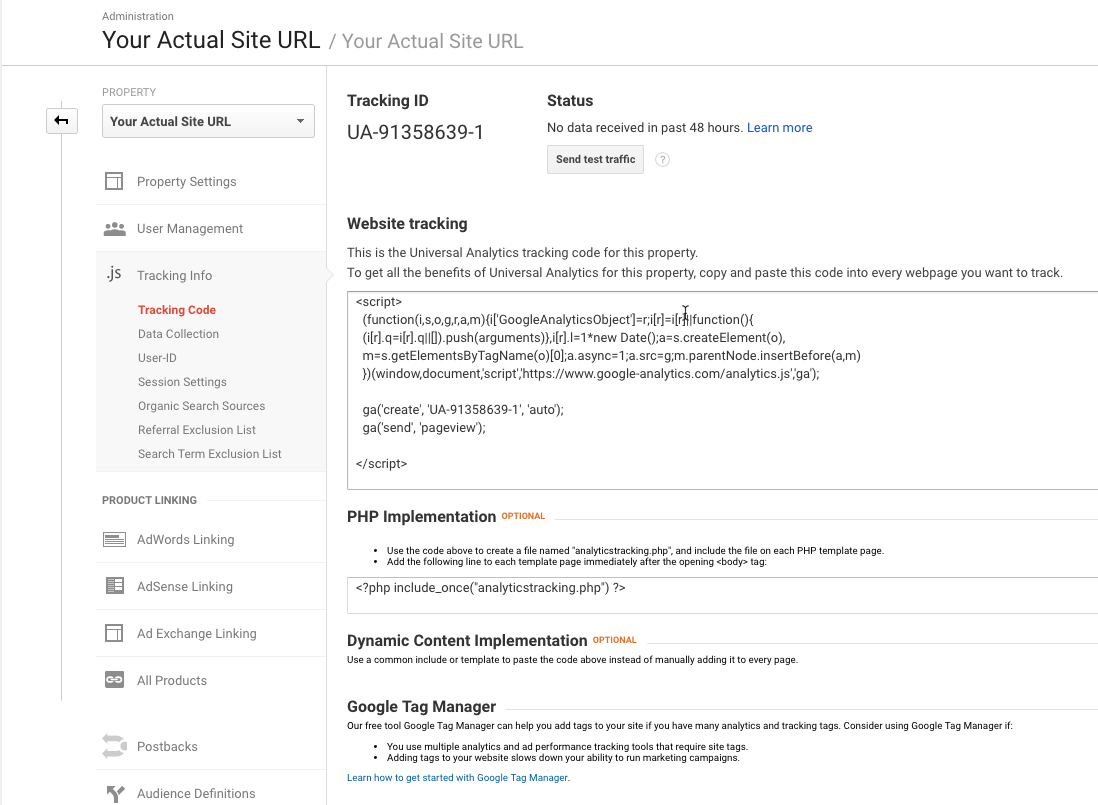
After you have all this setup you want to get your tracking code and install it on every page of your website, as well as other third party pages you use in your marketing funnel (like Infusionsoft by Keap Order Forms). You can put it into the HTML areas on your pages and for your website, there are several ways to install it (Google tag manager, WordPress plugins, or just past it in the header of your pages).
How to get data out of it
One thing to remember about Google Analytics is that the most accurate results are always up to the day before. Current day’s data is not accurate because full processing happens overnight.
Here are some key areas to look at for data.
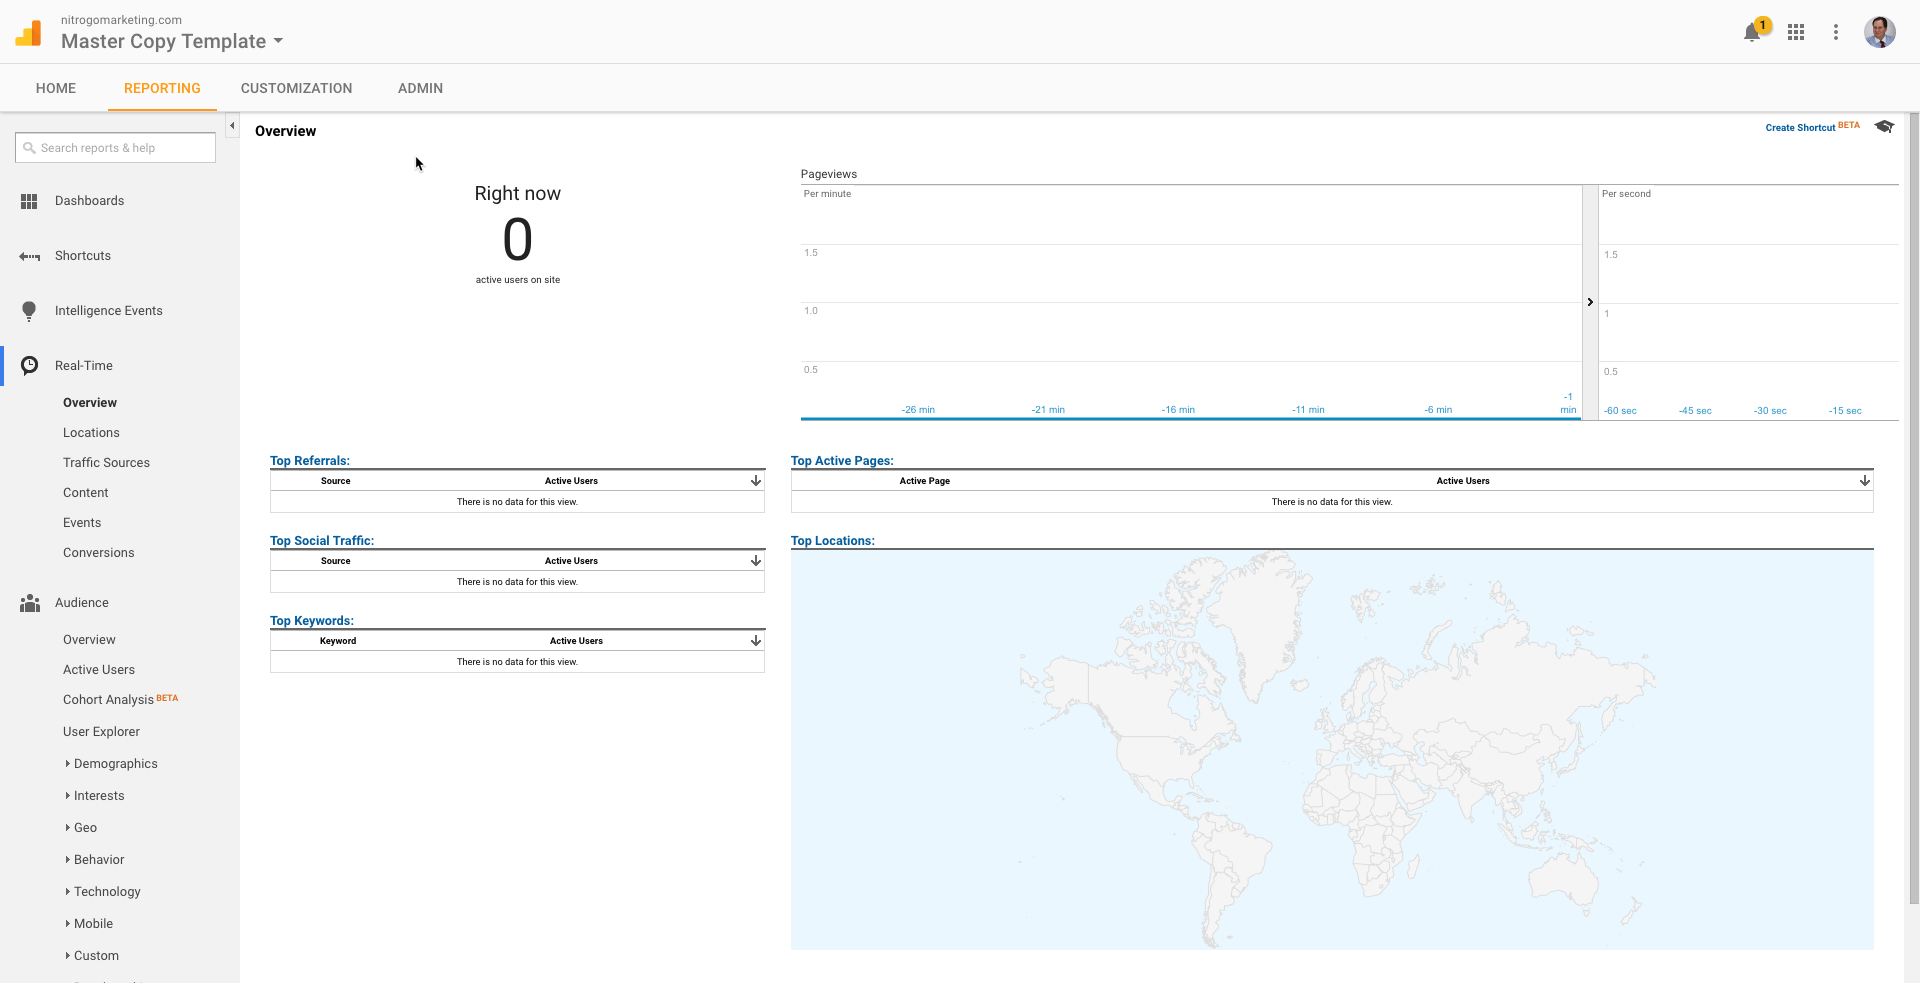
Real-time data: Good for looking at current visitors and seeing activity on your site. Has about 30 minutes of data. When in real time data, look at Locations (pages being visited), Traffic Sources (where traffic is coming from), Events (key events you have triggered on your site), and Conversions (goals and purchases triggered on your site).
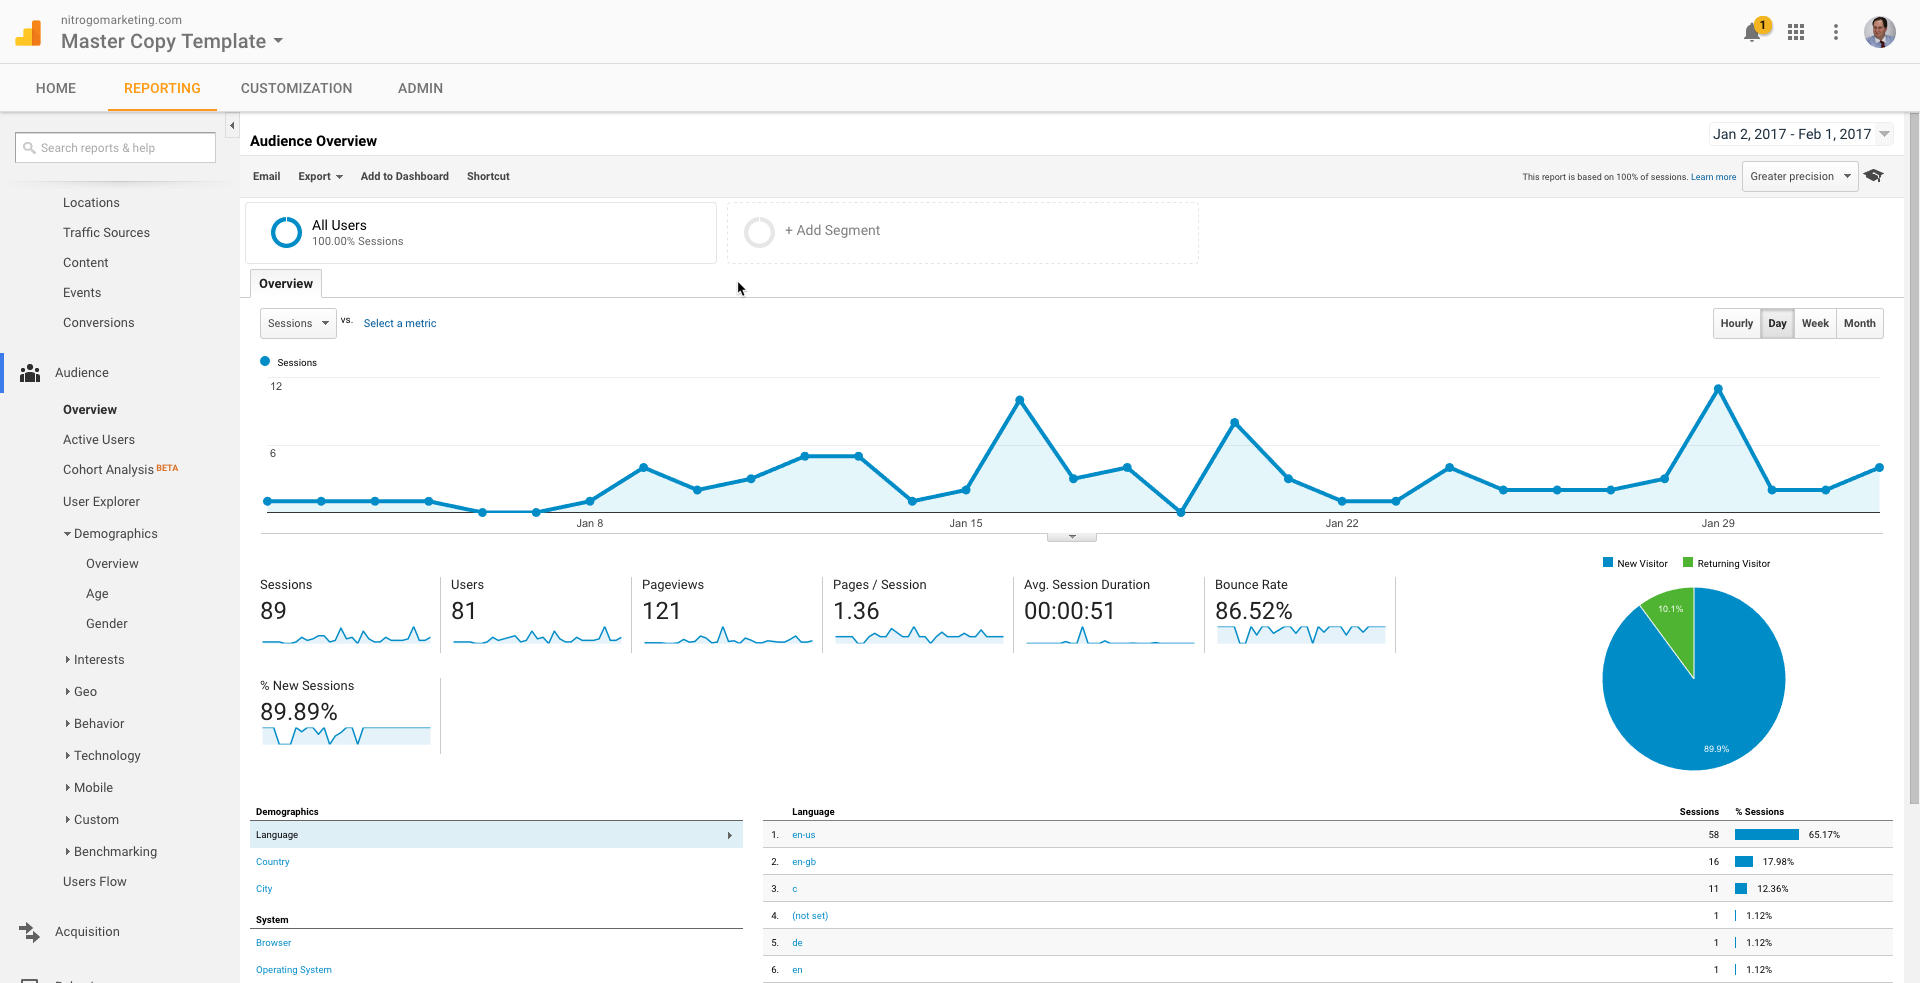
The next section to look at is Audience. This section will give you data such as age, gender, interests, geography, behavior, technology, and an overview of sessions, users, page views, time on site, and bounce rate.
You also want to look at the acquisition data to find out stuff like where your traffic is coming from, what keywords brought them to your site, what ads brought them to your site, etc. The behavior section will tell you stuff like the landing pages they visited and how they moved through your website, site speed, and event details.
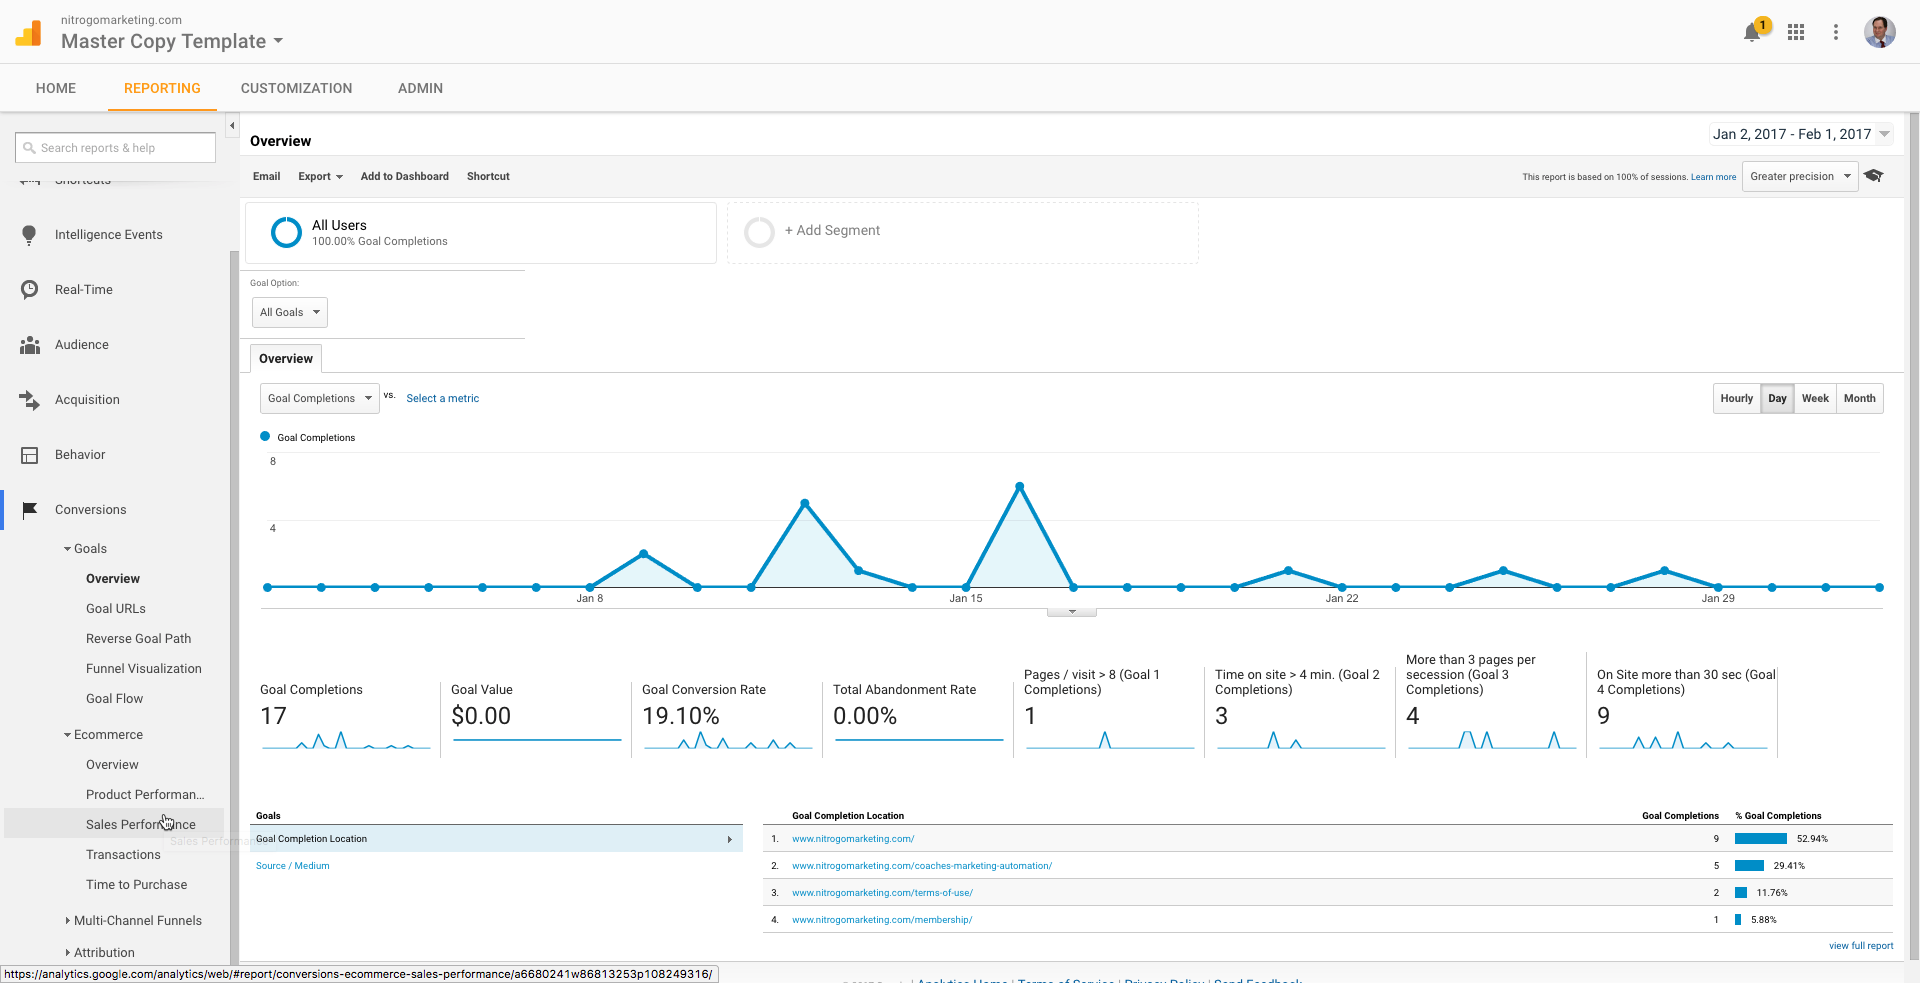
The last area to get data from is the conversion section. The conversion section will tell you how many times a goal has been met and how much that goal was worth if you assigned a value to the goal when you set it up. If you set up your goals as a funnel, you can also use the funnel visualization report to see the flow through your funnel and where people are dropping off. If you are sending e-commerce data to your analytics account, you can also see what products were purchased, how much was the value of the products purchased, and where the purchases came from based on the parameters you send with your analytics.
Audience reports give information about visitors:
- Age and gender (Demographics)
- General interests (Interests)
- Where they come from (Geo > Location)
- Language they speak (Geo > Language)
- How often they visit your website (Behavior)
- Technology they use to view your website (Technology and Mobile)
Acquisition reports tell how your visitors came to your site:
- All Traffic (All Traffic)
- Main categories (All Traffic > Channels)
- Specific sources (All Traffic > Source/Medium)
- Traffic from social networks (Social)
You can also connect to AdWords to learn more about your PPC campaigns and to Google Webmaster Tools/Search Console to learn more about search traffic (Search Engine Optimization)
Behavior reports tell about your content:
- Top pages on your website (Site Content > All Pages)
- Top entry pages on your website (Site Content > Landing Pages)
- Top exit pages on your website (Site Content > Exit Pages)
- Learn how fast your website loads (Site Speed)
- Specific suggestions on how to make your website faster (Site Speed > Speed Suggestions)
If you set up Site Search:
- What terms are searched for (Site Search > Search Terms)
- The pages they are searched upon (Site Search > Pages)
Conversions—as long as you set up goals or e-commerce
- How many conversions your website has received (Goals > Overview)
- What URLs they happened upon (Goals > Goal URLs)
- The path that visitors took to complete the conversion (Goals > Reverse Goal Path)
Speaking of goals and conversions, most of the tables within the standard reports will tie specific data to your conversions. For example:
- You can see conversions made from Facebook in the Acquisitions > All Traffic > Source/Medium report
- You can see conversions made by landing on specific pages in the Behavior > Site Content > Landing Pages report
You can use the dropdown at the top of that section of data to switch to the goal you want to view or all of your goals if you prefer.
This is just the starting point as you get more involved you can pull a treasure trove out of the data in Google Analytics.
If you want to become a pro, Google offers courses you can take online.

Robert Vance is a husband, father, small business owner, and author. He is an Infusionsoft by Keap Certified Partner, Digital Marketer Certified Partner, and Google Certified Partner. He helps businesses automate their marketing and get a positive ROI from their marketing efforts and makes sure they can track their ad spend and ROI. He created his first website in 1997 and has been marketing online since 2003.