How can you improve if you don’t measure progress?
This is why sales reports are an integral part of every business. They give you a clear picture of what’s working and what’s not while helping you make informed business decisions and improve your sales strategy.
Apart from meeting targets, sales managers are also expected to create and present reports to the senior management and stakeholders, giving them a detailed understanding of the sales activity.
Sales reports are prepared on a daily, weekly, monthly and yearly basis.
Let’s take a look at how you can write effective sales reports that offer accurate insights while keeping readers engaged and interested:
1. Set a goal
Presenting a monthly sales report to the senior management is not the same as sharing a weekly report with the sales team. Both the scenarios have a different audience and hence, demand a different approach.
The goal of a sales report depends on the audience you’re presenting to, helping you decide what information would be relevant to them.
So, before you write the sales report, narrow down the purpose and establish what you want to achieve from this report.
2. Define a timeframe
Defining a timeline is important because it lets you present a more accurate and specific picture. It also gets easier to make comparisons, analyze trends and come to logical conclusions.
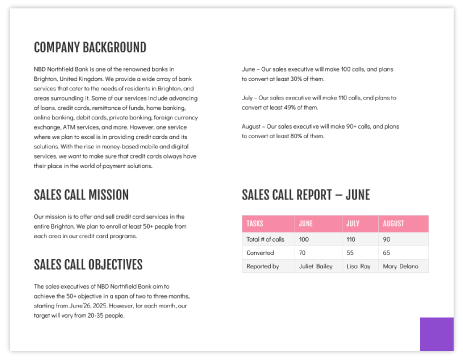
For instance, if you’re working on a monthly report, there is no reason to look into data from the beginning of the year. Instead, you should be focusing your efforts on analyzing the sales performance for that particular month.

Source: Venngage
3. Collect relevant data
Now that you’ve established the goal and timeframe, you need to gather the right data, which will form the basis of your sales report.
These are a few essential data points you can include:
As per a study, 91% of businesses suffer from sales data errors, which is responsible for an average of 12% loss in revenue. Make sure you check the accuracy of your sales data because its absence is sure to impact your analysis and reporting.
Hence, it’s a good practice to maintain data hygiene by performing regular audits and weeding out poor or outdated data.
4. Illustrate data visually
Sales is a numbers game but that doesn’t mean you can slap some numbers together and call it a sales report.
It’s important to tell a story with numbers and present them in an engaging way with the use of visuals. Visuals are powerful because they communicate the message without overwhelming the reader.
So, leverage data visualization tools such as infographics, graphs and charts to present data visually. This makes it easier to digest information, identify trends, and emphasize key points.
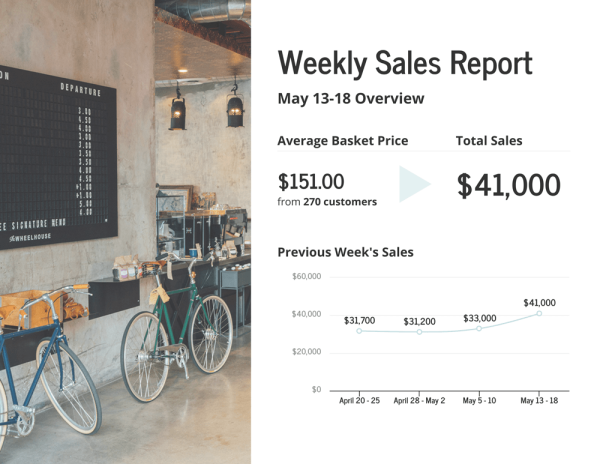
For example, you can use line graphs to indicate daily sales numbers or a pie chart to illustrate different sales channels.

Source: Venngage
5. Present your analysis
You’ve collected and presented the data but it doesn’t end there. What does all that data mean?
Whether you’re presenting to your subordinates or managers -- they want to know your interpretation of the data presented. Analyze sales performance, assess patterns and make comparisons to identify gaps in the sales process and uncover opportunities.
It’s important to explain the reason behind the data you present and offer context such that people can make sense of the report and relate to it.
6. Write a brief summary
Starting the sales report with a brief, one-page summary is a good practice because it gives readers an overview of what they can expect. Make sure you highlight the timeframe and the key takeaways from the report in this section.
This is especially useful in cases where you’re presenting an in-depth report to top-level executives or the senior management who usually doesn’t have the time to read the entire report.
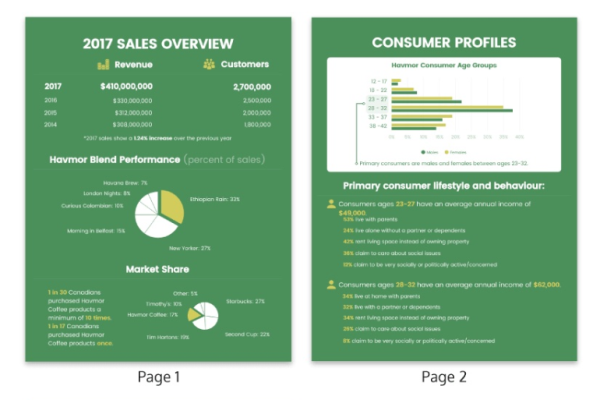
The summary doesn’t have to be text-heavy. Consider using visuals to present it and capture attention while sticking to a consistent color scheme.

Source: Venngage
7. End with an action plan
The best reports are action-oriented -- they provide an action-plan on the basis of the sales performance analysis.
For instance, if your sales are falling, it’s important to state a clear action plan asserting what your strategy is for the coming weeks and how you plan to increase sales.
So, end your sales report with a definite action plan that addresses the gaps and loopholes. Not only does this shed light on your proactivity, but it also helps you hold your team accountable and track progress effectively.
Writing an effective sales report: the takeaway
Sales reports are important tools that aid decision making, propel your team in the right direction and drive performance.
However, reports have a bad rap for being dry and boring but it doesn’t have to be that way. You can write reports that get the message across while keeping the audience engaged and interested.
So, apart from creating well-structured, accurate reports, it’s important to ensure they make for an effective read by thinking of creative ways to present your sales data and analysis.
Simki Dutta is a content marketer at Venngage, a free infographic maker and design platform. When she's not working, she can be found refreshing her Twitter feed and binge-watching Netflix shows. Find her on Twitter and LinkedIn.


