
With 2.3 billion monthly active Facebook users, you wouldn’t be wrong by calling Facebook a juggernaut. A lead magnet, if you will.
As a small business owner, that number has your heart a fluttering. You’re probably aware that advertising on Facebook is one of the dominant lead magnet examples, and you’ve heard whispers of "gold in them hills" from others who have made a killing in advertising on Facebook.
Facebook Lead Ads revolutionized the advertising market by bringing thousands of potential customers to your ads every day. People now spend less to acquire new customers, compared to old Facebook campaigns. The trick is to know exactly how much to spend on Facebook ads.
Most people, however, still use only 10 percent of Facebook Lead Ads potential, leaving the bulk of their potential clients to competitors.
First, I’m going to share seven easy ways to optimize and interpret Facebook Ad results by simply testing some ad parts. Some of these strategies work in any kind of Facebook campaign, and you may already know them. Other tricks are very specific for Facebook Lead Ads.
1. Try different images in the same ad set
A simple way to lessen the expense of your “Facebook battles” is image split testing. When you run a campaign on Facebook Ads, you need to identify a picture capable of “capturing” potential clients while they are surfing Facebook.
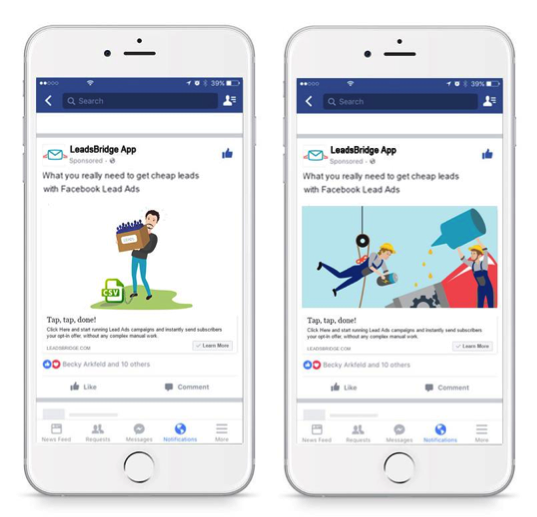
There is an easy test, which can be performed in minutes, consisting of creating two advertisements in the same ad set with two distinct pictures. Everything else in the ads should be identical.
Never stop testing images. When you think that you found a good one, continue testing. When you run the campaign, Facebook will automatically calculate the most successful one in terms of clicks and leads.
Here’s one of many effective Facebook ad examples testing different images to see which one gets better results:
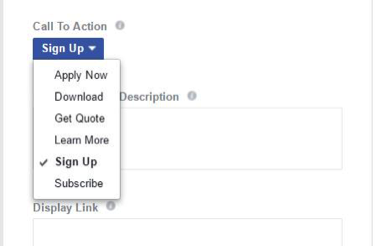
2. Try different call-to-action (CTA) buttons
The CTA is crucial for conversions, as it expands changes up to 10-15 percent. You can make another viable split test by contrasting two identical ads, presenting a variety of differences except for the CTA.
Sometimes a “sign up” button attracts more leads. In other cases, a “learn more” CTA gets the most clicks. When you identify the tag that best fit your objective, put your entire budget towards it and move on to the next split test.
3. Reduce fields
All marketers know that when you enter an excessive number of fields in the sign-up box of your ad, most people won't sign up. Facebook users prefer not to disclose too much personal information. If you want to get more leads, try to minimize the fields in your opt-in forms.
The less data you ask for, the more leads you get. However, be careful—asking for too little information can reduce the quality of your leads, especially with Facebook Lead Ads. To find out the right balance between sales and amount of leads, you should analyze your final profits at the entire funnel.
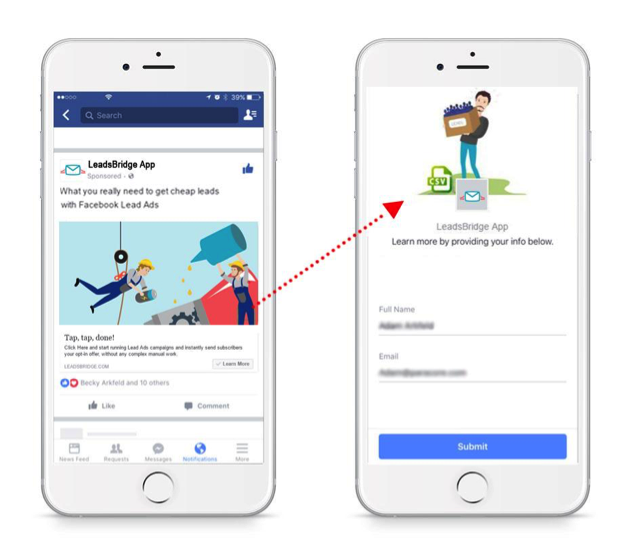
4. Use different images in the Lead Ad form
When you set up a Facebook Lead Ads campaign, you have the ability to select an image for your form. Below is a very simple split test. Create two identical ads with two different forms. In the first form, use the same image as the ad. In the second form, use another one. I know it sounds strange, but sometimes with Facebook Lead Ads, the latter option works better, especially if you are giving away free stuff.
Here’s an example of Facebook ads with different forms:
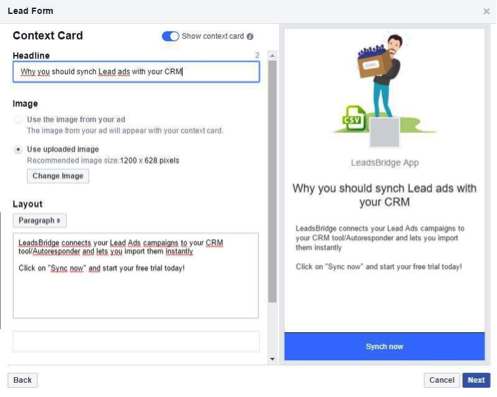
5. Try it without a context card
If you really want to cut out your funnel and make it short, just try not to use the context card and discover, instead, the famous “Tap, tap, done!” system. Thanks to their pre-filled forms, Facebook Lead Ads will increase your leads very fast.
By default, you can store these leads in a simple CSV that Facebook lets you download. So if you want to connect your Lead Ads campaigns to your CRM tool/Autoresponder you need a professional software that instantly sends subscribers your opt-in offer, without any complex manual work.
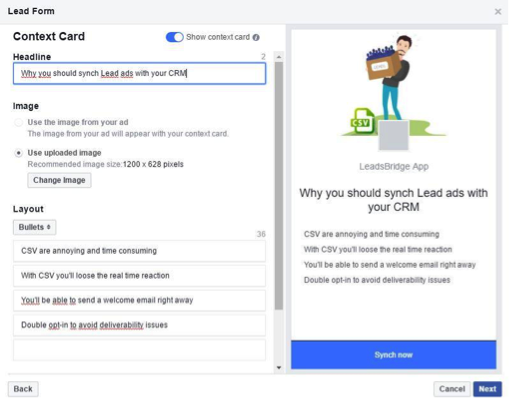
6. Use bullets or paragraphs in the context card
I noticed that by using Facebook Lead Ads, the cost per lead decreases along with the quality of leads. For this reason, I started testing the welcome screen. By adding a welcome screen you can make sure that people are aware of what they’re getting and how.
A context card provides more information. It looks like an info-card, which appears after clicking on your ad, before submitting personal data.
You can set up a context card and test it by using two different benefit texts: bullets or paragraphs.
Bullets are short sentences that briefly outline the benefits of your service or product. By using paragraphs, you can provide more information about what will happen next.
7. Connect your CRM and send a welcome email
For a successful marketing campaign, it's important to send an automated welcome email to your leads. The welcome email is the message your leads receive immediately after leaving their data. In fact, 74.4 percent of customers expect a welcome email when they subscribe and the average open rate for welcome emails is 50 percent—86 percent more effective than email newsletters.
Now that we’ve covered the things you should do to get results with your Facebook ads, let’s go over the things you don’t want to do so you can avoid these easy-to-make mistakes.
Six common reasons advertisers fail on Facebook:
1. Your ads aren’t relevant
Facebook “is” relevance, at least to its users, and for your ad to survive people need to think you’re significant and that your brand is worth engaging. No matter how good your product, if you can’t connect with your audience, Facebook won’t keep showing them your ad.
2. You’re whiffing at segmentation
Facebook aims to help your ad get to the right folks by sending it to the appropriate demographic and interest-based user segments. But if you’re using broad strokes to paint your campaign because you don’t have a clear idea of who your customer is, you can’t expect Facebook to.
3. Your ad isn’t interesting
Even if you are relevant and segmented, if your ad’s a bore, it’s not getting shown. Time to get inside your customer’s head and figure out what kind of personality your brand is going to need to convey to make a great impression.
4. You have too much competition
Depending on your profession, you may have to put in more time and money just to stand out from the pack. For instance, a plastic surgeon in Beverly Hills is definitely going to spend more than an arborist from New Jersey.
5. You aren’t following up with your Facebook leads
If you don’t have a customer relationship management (CRM) system in place, you’re going to have a hard time following up with leads. Especially if you’re the “ad whisperer” and have them clicking in droves.
One of our Keap customers was amazingly successful with Facebook Ads before they had Keap, garnering 200 leads at $2 per lead in a time span of only 48 hours. Problem was, they had no way to field that many leads.
It was kind of like having a broken, overflowing soft serve machine in a room full of people with no cones—wasted ice cream all over the floor.
There is no getting away from the fact that unless your lead is immediately and perpetually engaged, the relationship will die quickly. Marketing automation software, coupled with a robust CRM, ensures that your all leads have a soft, warm place to land and supports you throughout your nurturing campaign.
6. You aren’t tracking conversions
An analogy, if you will: You have $1,000 to invest. You take it to a financial advisor and tell him you would like to invest $100 a piece in 10 different opportunities of his choosing.
Let’s say he comes back in a week and says, “Guess what! We made $5. You now have $1,005.” And you say, “Fantastic!” and take your profit for the week and walk away.
What’s missing here? Sadly, too many business owners don’t know.
The problem is, the first words out of your mouth should have been, “Great! Which investment did the profits come from? Which investments didn’t do well?”
You have to carefully look at your Facebook ad metrics and understand where your conversions come from so you know which of your ad campaigns are working. Of the business we deal with, 50 percent have no conversion tracking in place. Out of the other 50 percent, half of those are doing it wrong.
When using Facebook ads, it’s imperative to install a Facebook Pixel on every web page you need to track. By tracking Facebook ad stats so you know how many conversions each ad brings in, we can see which ones are working and capitalize on what we’re doing right. Conversely, we can also get rid of or fix ads that aren’t performing well.
If you don’t have anyone who already knows how to install their Facebook Pixel, you can find instructions for Facebook Pixels online. It can be tedious work, but it won’t be long before you see why it’s so necessary to track Facebook ad metrics.
Speaking of metrics, let’s dive deeper with some information that’ll help you interpret Facebook ad stats.
Let’s start with some of the most important metrics:
Cost-per-action (CPA)
For any conversion-based campaign, where your objective is to collect leads, registrations, or something else, this is the main metric to pay the most attention.
This is called “Results” in Facebook’s lingo, but it is changed up based on what you are tracking. If you are optimizing for leads, then your Ad Manager will say “Leads,” and so on.
The Results column tells you how many results you have, while the Cost column tells you how much you are paying per result.
This is what I care about the most—the Cost column. That’s the cost-per-action (or cost-per-lead, per registration, etc). If the cost is low, I celebrate, I’m happy, and I don’t change up too many things.
If the cost is high, that’s when I dig deeper into other metrics to understand why. Obviously, the cost is relative and it differs and varies a lot based on the type of offer, the audience, type of traffic, industry, and more.
Click-through rate (CTR)
This is the second metric I pay a lot of attention to. It basically tells you how often people are clicking on the ad in relation to seeing it in their feed.
To view this metric, select the Column “Performance and Clicks” and then scroll all the way to the right. There will be two CTR columns.
You want to focus on the very last one, on the far right, which focuses on link clicks CTR, not ALL clicks (which includes any and all clicks, not necessarily those that click to visit the website or landing page you are aiming to drive traffic to).
I like to keep my CTR around or above 1 percent for cold audience traffic. For warm traffic, that percentage should be higher.
If your ads are expensive, this can be a big tell-tale sign as to what the problem is. Is it the ad or the landing page, that’s causing the high costs-per-conversion or cost-per-clicks?
Cost-per-click (CPC)
Speaking of cost-per-click, this metric is mostly used when using website clicks campaigns (traffic objective rather than conversions). There are many reasons why you would use this objective. When traffic is the main objective, you do not see the results in terms of conversions or actions taken on the default report.
That’s when we begin looking at the cost-per-click. How much does it cost you to send one view to your website? This should be as low as possible.
I don’t look at this unless I am running website traffic ads. If your goal is to get leads, I recommend avoiding this objective unless you have a deeper strategy for using it and would consider yourself more advanced, otherwise, you may end up spending more money overall.
Link clicks
This is the metric that tells you how many times your website link has been clicked.
This is an important one, and it’s important not to be confused with clicks (all), which just tells you how many total clicks there were (including clicks on the ad, to “read more,” to leave a comment, etc). This tells you if people are actually going to your webpage.
Now, here are some Facebook ad stats I don’t really pay attention to unless something funky is going on:
Reach
This is the number of people who have seen your ads. It’s the cousin to “Impressions” which basically tells you how many total times your ad has been viewed.
I don’t look at this number as much unless it is very low when it shouldn’t be. I’ve had my clients and students come across this issue a lot lately, where their cold audience ads are getting little-to-no reach. It shouldn’t be happening. So at that point, I would look to see what’s going on. Why is the reach low?
If the reach is increasing, and it’s a fairly big number (for a fairly big audience), you have nothing to worry about. This is going to be reliant on your audience size and daily Facebook budget, of course, so any simple blanket advice doesn’t apply here. But if you are setting your ads up properly, you shouldn’t be having issues with this.
Relevance Score
This metric basically tells you how relevant your ads are to your audience. Are people engaging with the ad? Are they clicking on it or saving it? Or are they flagging it as inappropriate? Based on these, plus many other actions, Facebook then tells you the relevancy.
This might be against what you’re used to hearing, but I frankly don’t care too much about this metric. Is my Facebook advertising cost per lead low? Great! In fact, I often see ads that have a high Relevance Score have an excessively high cost per leads, whereas those with lower scores, cost very little. So, since I really care most about money in and money out, I don’t care about this as much as people might claim you should.
In order to see your Relevance Score, you have to look at your ad level in the Ad Manager. So, click on the Campaign, then the Ad set, then you’ll be able to see it on the right side next to each ad.
Anything above six is great.
As long as your ads don’t have a Relevance Score of three or less, you’re unlikely to get flagged.
Cost-per-thousand (CPM)
I don’t really care a whole lot about this number. Does this make me a bad marketer? I’m all about simplicity and knowing how much I spend per thousand impressions isn’t going to tell me much. I consider this a vanity metric unless you’re doing something very specific that requires your attention on it.
Frequency
This is a metric that tells you how many times your ads are being seen by people. In order to view this, you have to click on “Columns” and then select “Performance and Clicks.”
I don’t usually track this, especially if my cost-per-lead is low. And it’s usually not a big deal, especially if you are running ads to a large cold audience. However, once you start seeing your ads increase in cost, it’s a good idea to check this metric to see why the cost may be increasing.
If the ads have been running for a while, it could be that they are being shown too many times in front of people and the audience is becoming exhausted. It might be time to switch up the target audience or change the image to freshen it up.