In 2020, using social media for business will be more prominent than ever before. There are currently 3.5 billion active social media users, according to ourworldindata.org. With such an outstanding statistic, it’s more important than ever for businesses to have a stake in the market.
However, social media algorithms never stay the same for long, and with a rapidly changing technology landscape, neither do user trends. Because of this, small business owners need to stay on top of their social media game by testing out new strategies around app updates and evolving consumer behavior.
Here are the social media engagement statistics for 2020:
Businesses
- Percentage of retail brands that use two or more social media platforms: 91% (Falcon.io)
- Sharing video content usage: Facebook: 81%; YouTube: 62%; Instagram: 57% (Falcon.io)
- The likelihood that consumers would recommend a brand on social media to others: 71% (Falcon.io)
- Percentage of consumers who would rather contact a brand's customer service via social media rather than by phone: 33% (Falcon.io)
- Percentage of marketers who do not have a budget allocated for influencer marketing: 85.8% (Falcon.io)
- The most popular global messenger app: Whatsapp with 1.6 billion active users (Falcon.io)
- Percentage of people who use social media for product research: 54% (Falcon.io)
- Most downloaded social media app in 2019: TikTok (Falcon.io)
- Percentage of users who'd rather watch a brand video than read a blog: 80% (Falcon.io)
- The percentage marketers who plan to increase their digital video budgets by: 25% (Sprout Social)
- The amount marketers spent on social media advertising in 2019: over $89 billion (Sprout Social)
Demographics
- World population as of November 2019: 7.7 billion people (Falcon.io)
- Number of people who have access to the internet: 4.33 billion people, with 3.499 billion being active on social media (Falcon.io)
- Social media participation by generation: percentage of millennials: 90.4%; Gen X: 77.5%; Baby Boomers: 48.2% (Falcon.io)
- Average time spent on social media per day: 144 minutes (Falcon.io)
- The amount of social media accounts the average person has: 9; average daily usage: 2 hours and 16 minutes (Statusbrew)
- Percentage of social media users who access their platforms via mobile devices: 91% (Oberlo)
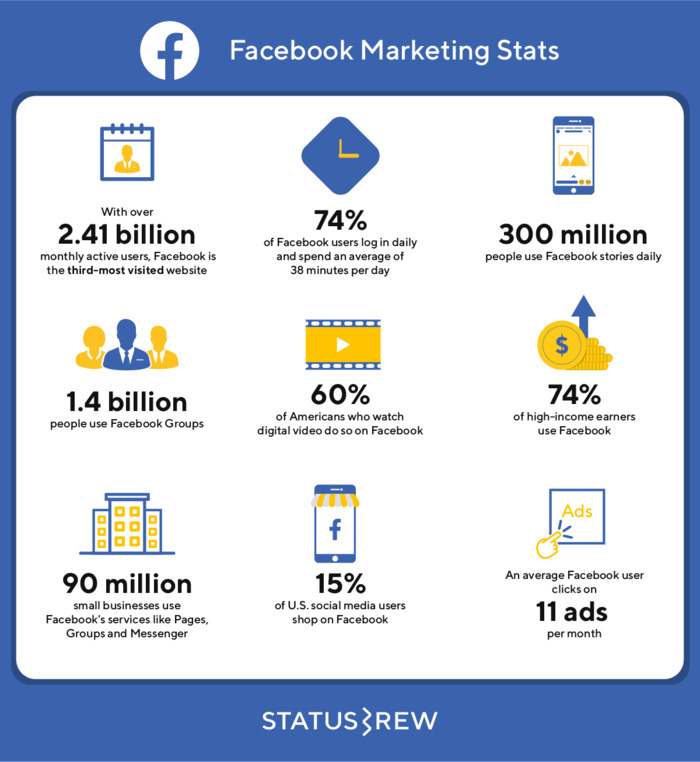
Image credit: Statusbrew
- Number of active monthly users as of November 2019: over 2.41 billion (Statusbrew)
- Percentage of active Facebook users that log in on a daily basis, spending an average of 38 minutes per day on the platform: 74% (Statusbrew)
- Number of people who use Facebook stories on a daily basis: 300 million (Statusbrew)
- Number of people who use Facebook Groups: 1.4 billion (Statusbrew)
- Percentage of Americans who watch digital videos on Facebook: 60% (Statusbrew)
- Number of small businesses that use Facebook Pages, Groups and Messenger: 90 million (Statusbrew)
- Percentage of users who shop on Facebook: 15%. (Statusbrew)
- The number of ads Facebook users click on per month: 11 (Statusbrew)
Take Keap's Lifecycle Automation Assessment to identify growth opportunities for your business.
- Number of Instagram users the platform will see in 2020: 112.5 million (Statusbrew)
- Percentage of users active every day: 63% (Statusbrew)
- Number of people who visit one business profile every day: over 200 million (Statusbrew)
- Engagement with brands on Instagram compared to Facebook: over 10 times higher (Statusbrew)
- Viewed stories from businesses: 33% (Statusbrew)
- The number of Instagram users who engage with shopping posts every month: 130 million (Statusbrew)
- Percentage of social referral shares for ecommerce sites 10.7% (Statusbrew)
- Percentage of users who shop on Instagram: 11% (Statusbrew)
- The best days to post on Instagram are Monday, Wednesday and Thursday. The best times to post are 11 a.m - 1 p.m. and 7 p.m. - 9 p.m. (Keap)
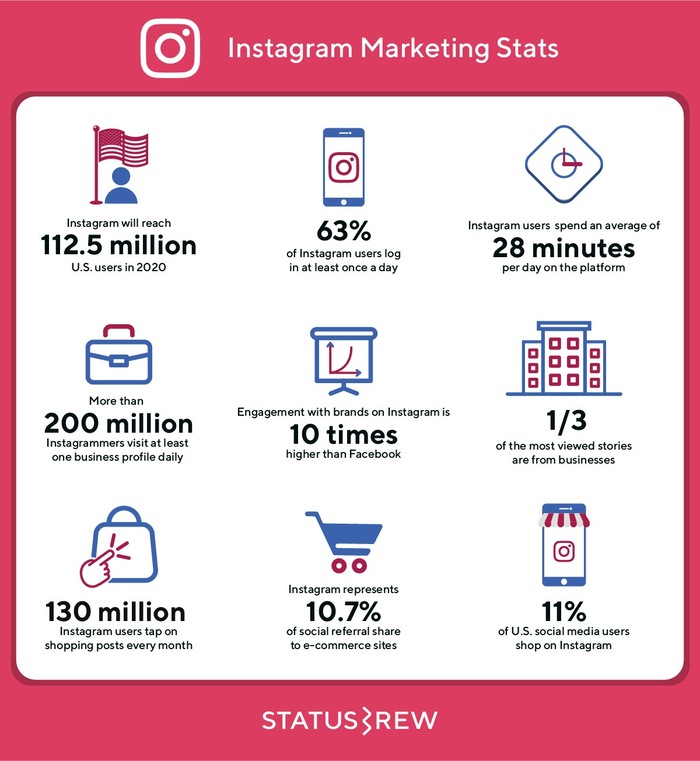
Image credit: Statusbrew
- Number of monthly active users (MAUs): 330 million; number of daily active users: 152 million (Omnicore)
- Percentage of Twitter users who use the mobile app: 80% (Omnicore)
- Worldwide Twitter users: 262 million, comprising 79% outside the U.S. (Omnicore)
- Number of MAUs in the U.S.: 48.35 million (Omnicore)
- Number of tweets sent per day: approximately 500 million (Omnicore)
- Percentage of Twitter users between ages 18 and 29: 38%; between ages 30 and 49: 26%. (Omnicore)
- Number of marketers who are active on Twitter: 59% (Statusbrew)
- Percentage of those who have made a purchase directly from an influencer's tweet: 40% (Statusbrew)
- Twitter's advertising revenue: $885 million (Omnicore)
- Percentage of small to medium businesses that use Twitter to provide customer service: 85% (Statusbrew)
- Percentage of total ad engagements: 91% (Statusbrew)
- Revenue generated in the U.S. alone: $591 million (Omnicore)
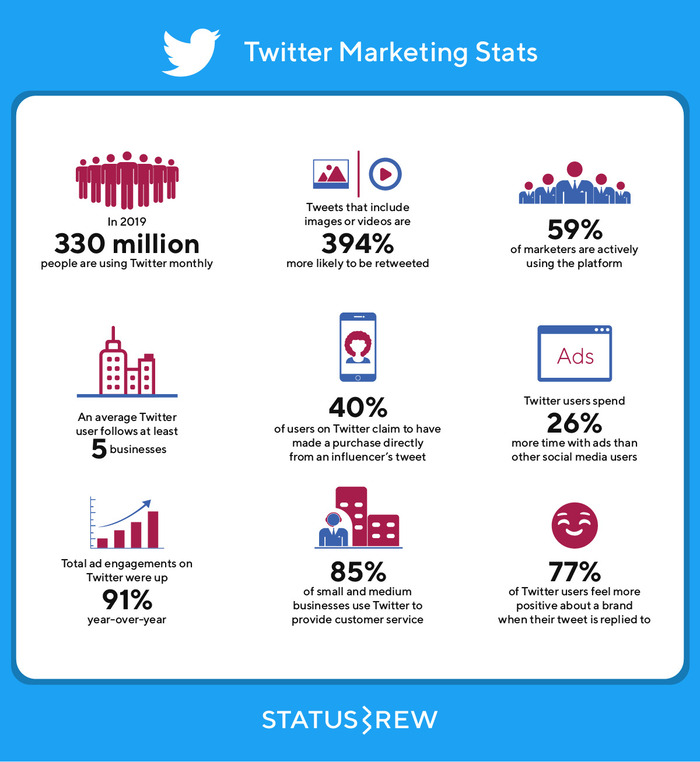
Image credit: Statusbrew
- Number of registered users: 660 million; MAUs: 303 million (Sprout Social)
- Lead generation and customer acquisition over Facebook: 277% more effective (Sprout Social)
- Percentage of marketers who gained customers via LinkedIn: 45% (Sprout Social)
- Percentage of B2B companies that have used LinkedIn paid ads to accumulate customers: 65% (Sprout Social)
- Percentage of B2B content marketers who've used LinkedIn for organic content marketing: 95% (Sprout Social)
- Percentage of B2B content marketers who've used LinkedIn as a paid social media platform: 76% (Sprout Social)
Other social media stats and facts
- Global ad spend on social media reached over $98 billion by the end of 2019. (Statusbrew)
- One billion hours of video are watched on YouTube daily. (YouTube)
- The percentage of marketers who believe social media marketing was effective for their businesses in 2019: 73% (Oberlo)